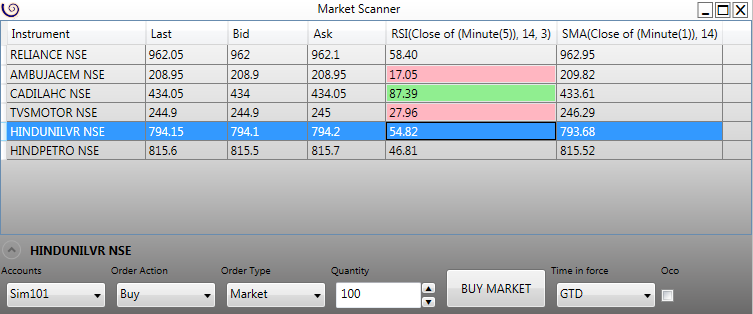
Market Scanner View |
The Market Scanner is an advanced view which lets one to take a closer look at the market. One can add different metrics to get an in-depth analytical view of the market.
One can apply in indicator in the Market Scanner and scan the market, in realtime (or on historical data)
User can further custom code a Market Scanner Columns and display custom matrix. To know more please refer here
Please follow the below steps to add a Price columns:
- Right click on the Market Scanner View
- In the context menu click on 'Select Columns'
- In the Column Selector dialog select the 'DataType' from the top left listbox and click on the Add button.
- In the Selected Scanner listbox, select the newly added object.
- On the right pane, select an appropriate Market Data Type like Last, Bid, Ask etc
- Repeat step 3-5 to apply more data matrix.
- Click on the Ok button.
Note: The availablity of the data metrix depends on your connectivity provider and can vary from connection to connection.
Please follow the below steps to add a Volume columns:
- Right click on the Market Scanner View
- In the context menu click on 'Select Columns'
- In the Column Selector dialog select the 'VolumeDataType' from the top left listbox and click on the Add button.
- In the Selected Scanner listbox, select the newly added object.
- On the right pane, select an appropriate Market Data Type like Last (for Last Traded Volume), Bid (for Bid Volume), Ask (for Ask Volume), Total Volume, Open Interest etc
- Repeat step 3-5 to apply more data matrix.
- Click on the Ok button.
Note: The availablity of the data metrix depends on your connectivity provider and can vary from connection to connection.
The Market Scanner allows one to add an indicator and view the values of the selected series. The values are updated in real-time and is a great way to scan the market metrics as it unfolds. Please follow the below steps to add an Indicator:
| 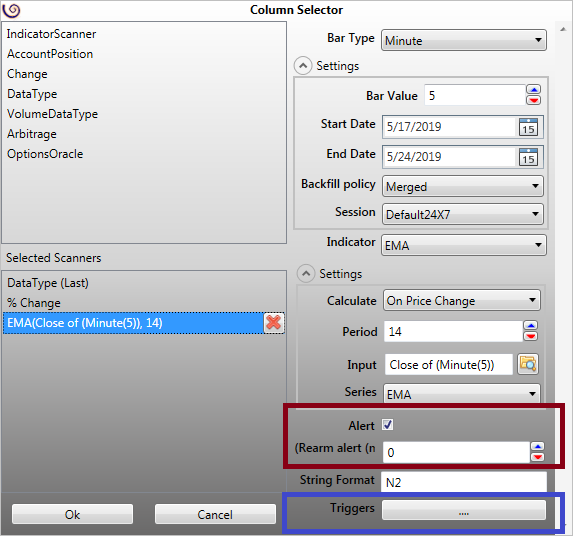 |
While applying an Indicator in the Market Scanner View user has the option of triggering an Alert. An alert will be triggered if the last traded price (LTP) crosses above or crosses below the indicator series value. This works fine for any price based indicators like SMA etc. However indicators like RSI etc which are oscillators in nature, will not work as their values do not conform with LTP. As such user can further custom code the indicator and define the alert condition. For more details please refer here
User can also override the AlertScanner(TimeSpan) method and trigger an Alert for non-price based indicators. The RSI indicator which comes natively with ArthaChitra for example, when appliend on the Market Scanner will trigger an alert (if alert is enabled) when the RSI value crosses above 70 or below 30.
User can also rearm the alert by defining a time in the option 'Rearm alert (in minute)' from the GUI. If the rearm value is set to 0 (zero) then the rearm feature will be disabled and the alert will trigger only once.
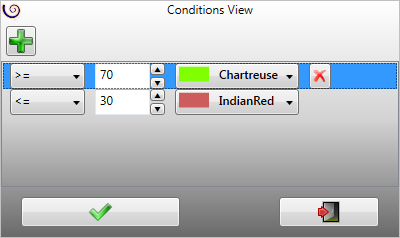 | If you want to change the background color when the indicator series matches some value then you can do so by adding a trigger.
|
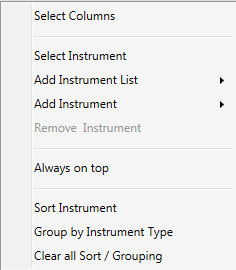
The context menu can be invoked simply by right-clicking on the Market Scanner View. The context menu items are as follows:
|  |